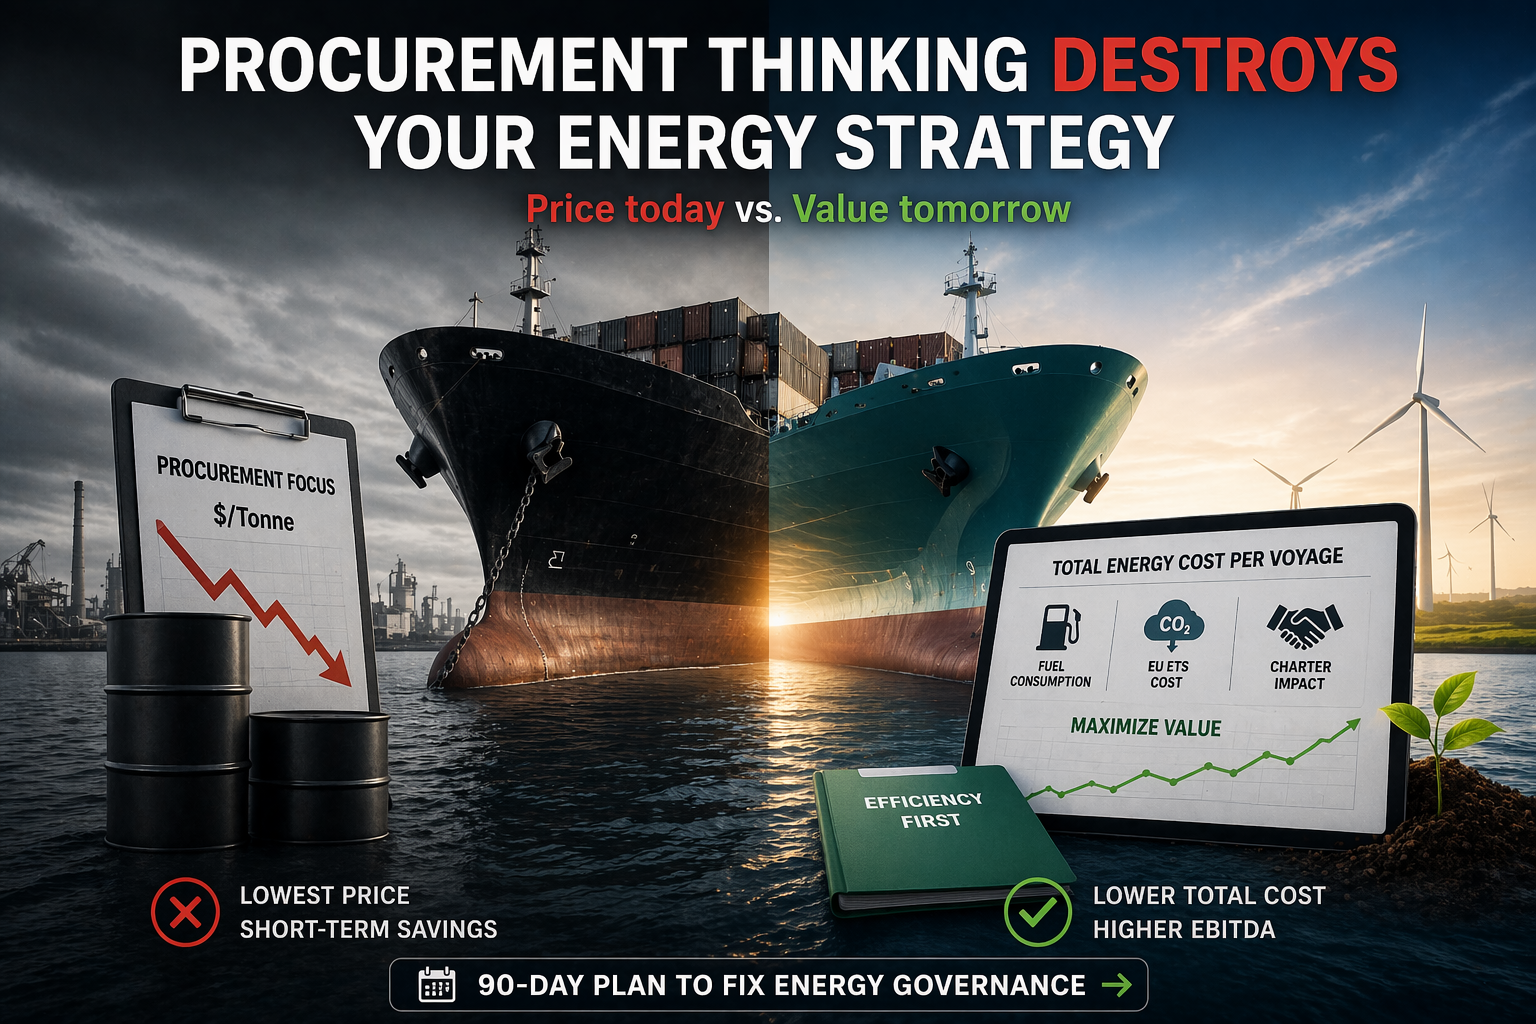
Why Procurement Thinking is Destroying Energy Strategy
EFFICIENCY BEFORE FUEL · SERIES POST 12 · WEEK 17, PART II · APRIL 2026
Treating Bunker Fuel as a Commodity Line Item Is the Fastest Way to Lose Competitive Edge in 2026
Maritime Industry | Energy Strategy | Strategic Intelligence Brief | René Grywnow, DBA
Procurement is a discipline built around a single objective: minimise the price of a unit of input. In most business contexts, that is exactly the right objective. In maritime energy management in 2026, it is the wrong objective applied to the wrong variable, and the cost of that misapplication is measured in millions of avoidable EBITDA loss, chronic regulatory exposure, and a competitive position that erodes faster than any bunker price spike.
EXECUTIVE SUMMARY
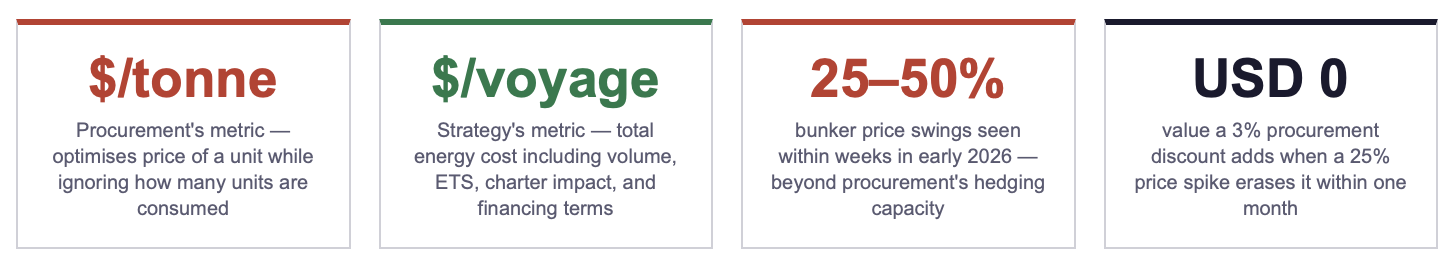
Procurement departments optimise for price per tonne. The correct variable is total energy cost per voyage, a metric that includes consumption volume, regulatory liability, and commercial positioning, none of which procurement thinking captures. The gap between these two metrics is the cost of the structural misalignment.
Lloyd's List Shipping Podcast episodes throughout early 2026 document a consistent finding: bunker volatility and regulatory exposure have elevated energy from a procurement function to a strategic risk requiring CEO and CFO-level governance. Companies still managing energy through a procurement lens are operating a decade behind the market reality.
The strategic alternative, demand-side energy management, inverts the logic: reduce the volume first, then optimise the reduced volume. BCG (2025) confirms that companies following this sequence achieve structurally lower energy cost per voyage in every price scenario, independent of commodity market conditions. The savings compound; procurement gains do not.
1. The Procurement Trap: Optimising the Wrong Variable
Procurement thinking about bunker fuel operates on three assumptions that were broadly valid before 2020 and are structurally false in 2026. The first assumption: fuel price is the primary variable. The second: hedging and forward contracts are the primary risk management tool. The third: the procurement function is the appropriate owner of energy cost.
All three assumptions have been invalidated by the convergence of geopolitical volatility, CII enforcement, and EU ETS integration. Consider what has changed in each dimension. On price: the March 2026 VLSFO spike of USD 174/MT in a single month exceeded the annual savings achievable by most procurement programmes. On hedging: the Strait of Hormuz threat scenarios that drove Q1 2026 volatility were not forecastable through commodity price models, they were geopolitical events that no hedge structure was positioned to manage. On governance: the Poseidon Principles, Sea Cargo Charter, and EU ETS have made energy performance a credit input, a charter selection criterion, and a regulatory liability simultaneously, none of which procurement has the mandate or the tools to address.
📻 LLOYD'S LIST PODCAST: JANUARY 2026
The episode "What to look out for in decarbonisation in 2026" documents the structural shift explicitly: energy management has moved from a technical and procurement function to a commercial and financial decision-making domain. Owners who have not restructured their energy governance accordingly are managing with the wrong function in charge of the wrong metric at the wrong organisational level.
Source: Lloyd's List Shipping Podcast, "What to look out for in decarbonisation in 2026," January 2026.
The cost of the procurement trap is not theoretical. For a Panamax operator whose procurement team achieves a consistently strong result, say, a 3% discount below spot on an annual contract, the saving at USD 620/MT is approximately USD 408,000 per year. A 25% price spike eliminates that saving within weeks and cannot be recovered through any procurement lever. Meanwhile, the same Panamax operator who invested in a combined drydock efficiency package saves USD 2.04 million per year in reduced consumption volume, permanently, at every price level, with no counterparty and no renewal requirement. The procurement saving is fragile and temporary. The efficiency saving is structural and permanent.
This is the procurement trap in its most precise form: a function optimising a variable that delivers fragile, temporary gains, while the structural alternative, demand reduction, delivers permanent, compounding gains that procurement thinking does not even recognise as within its remit.
👉 Key Insight: Procurement thinking minimises short-term cost while maximising long-term risk. It optimises price per tonne while consumption volume, the larger variable, remains unaddressed. A 3% procurement discount on 22,000 MT/year saves USD 408k. A 15% efficiency improvement saves USD 2.04 million on the same vessel. The correct intervention is clear. The question is why procurement thinking continues to crowd it out.
2. How Procurement Destroys Long-Term Value: Three Mechanisms
The damage from procurement-led energy management is not confined to missed efficiency savings. It operates through three distinct mechanisms, each of which compounds the others over time.
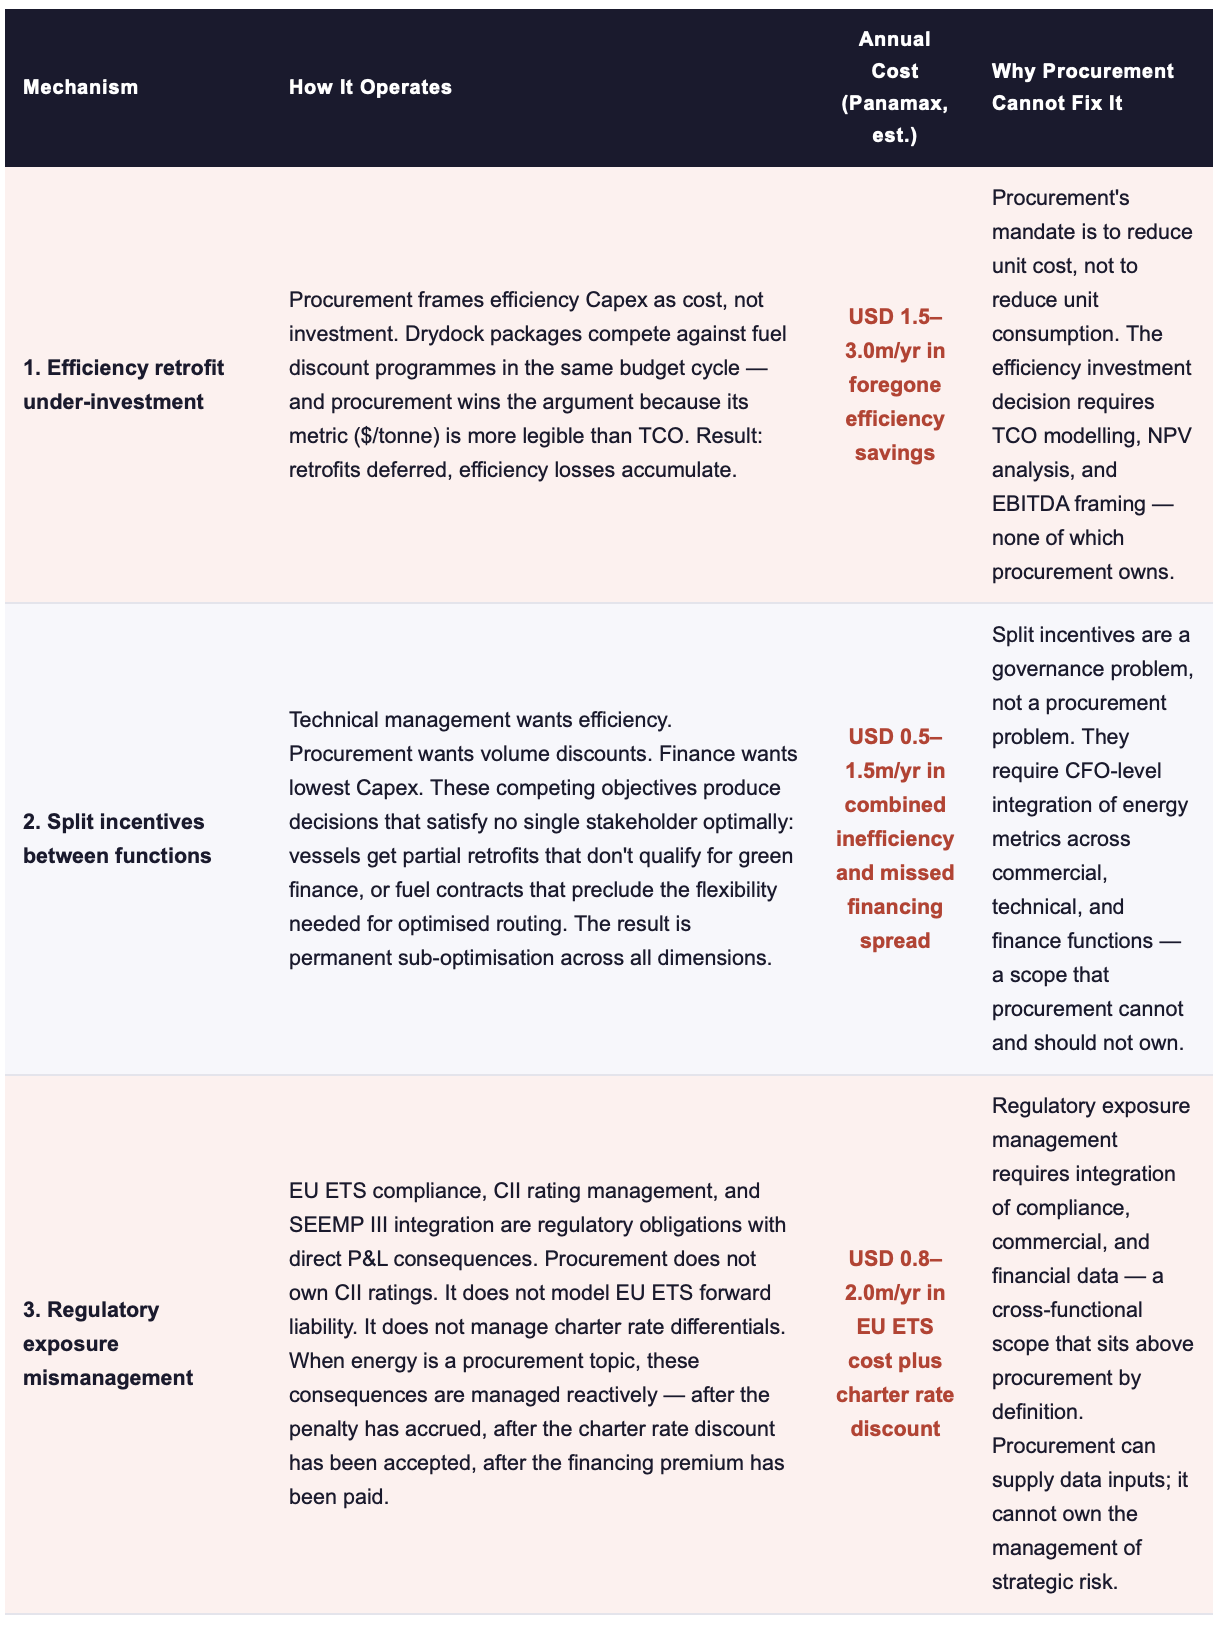
Cost estimates for Panamax 65,000 DWT, VLSFO $620/MT, EU ETS €50/tonne CO₂. Sources: BCG, 2025; PwC, 2026; own modelling based on efficiency saving benchmarks from ABS, 2025.
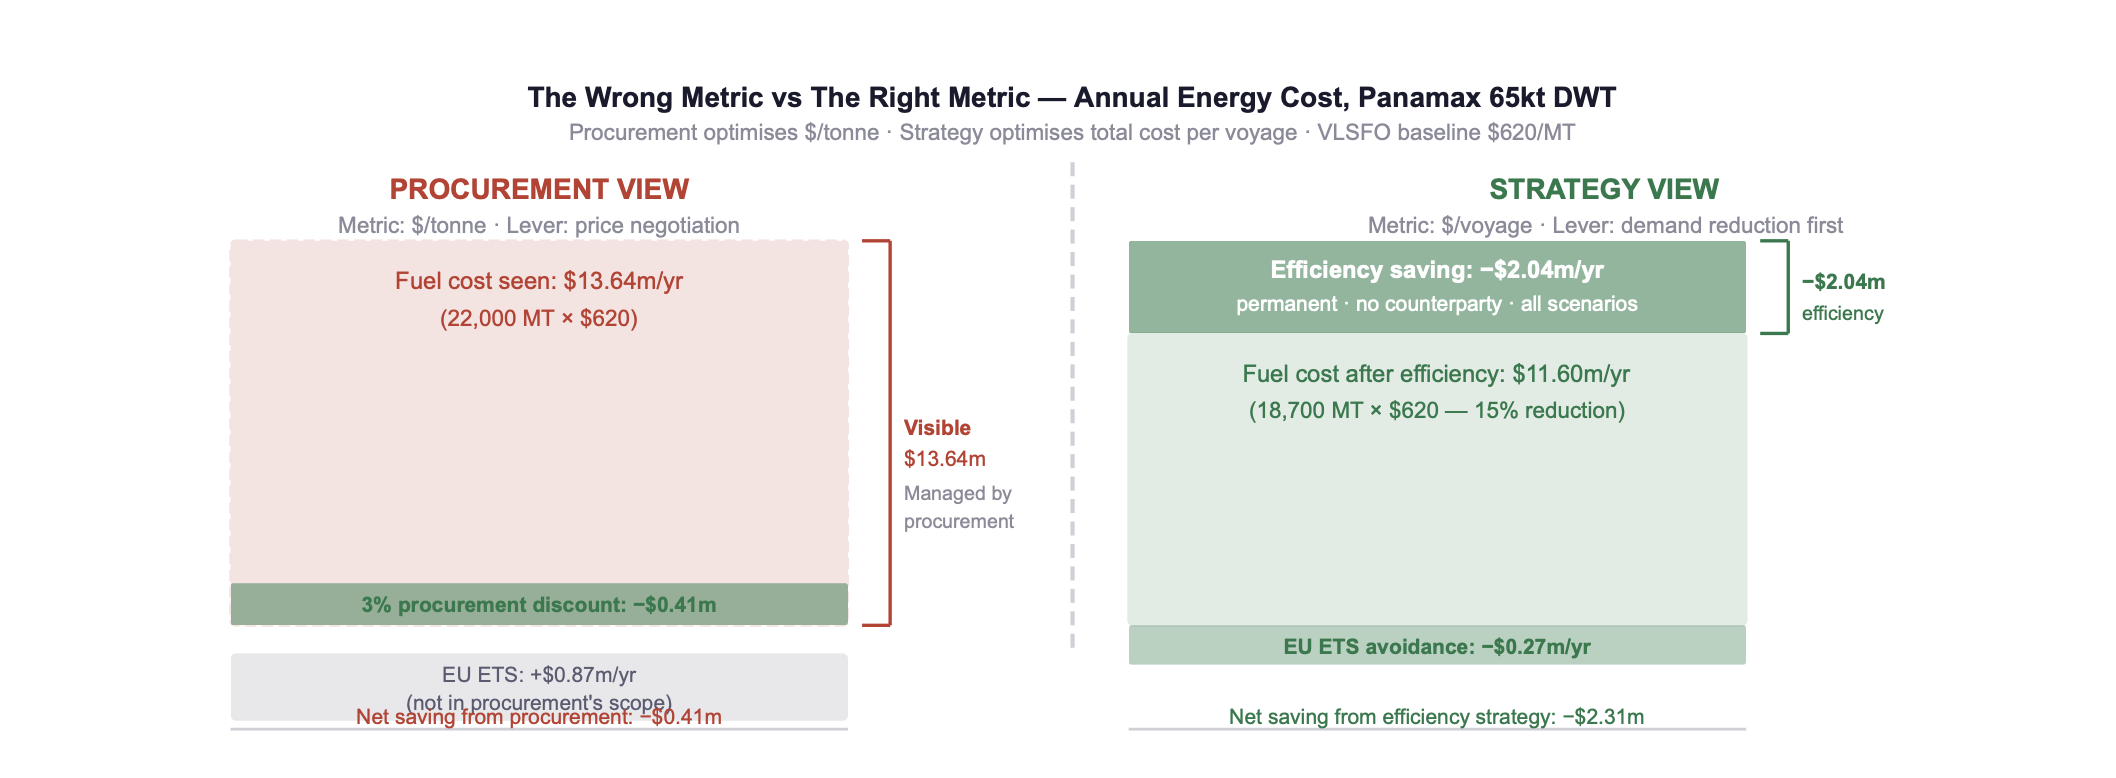
Fig. 1: Procurement (left) manages the price of 22,000 MT and achieves a 3% discount: −USD 0.41m. Strategy (right) reduces consumption by 15% and captures EU ETS avoidance: −USD 2.31m. The strategy lever is 5.6× more valuable and is structural rather than market-dependent. Sources: ABS, 2025; PwC, 2026; own modelling.
👉 Key Insight: Procurement cannot solve a volume problem with a price lever. The three mechanisms above, retrofit under-investment, split incentives, and regulatory exposure mismanagement, all share the same root cause: the wrong function owns the wrong metric. Until energy cost per voyage replaces price per tonne as the primary KPI, the structural misalignment will persist and compound.
3. The Strategic Alternative: Demand-Side Energy Management
The Global Maritime Forum's Operational Efficiency Report (January 2026) provides the clearest framework for what demand-side energy management looks like in practice. The core principle is sequence inversion: reduce demand first, then optimise the reduced demand. The contrast with procurement thinking is total.
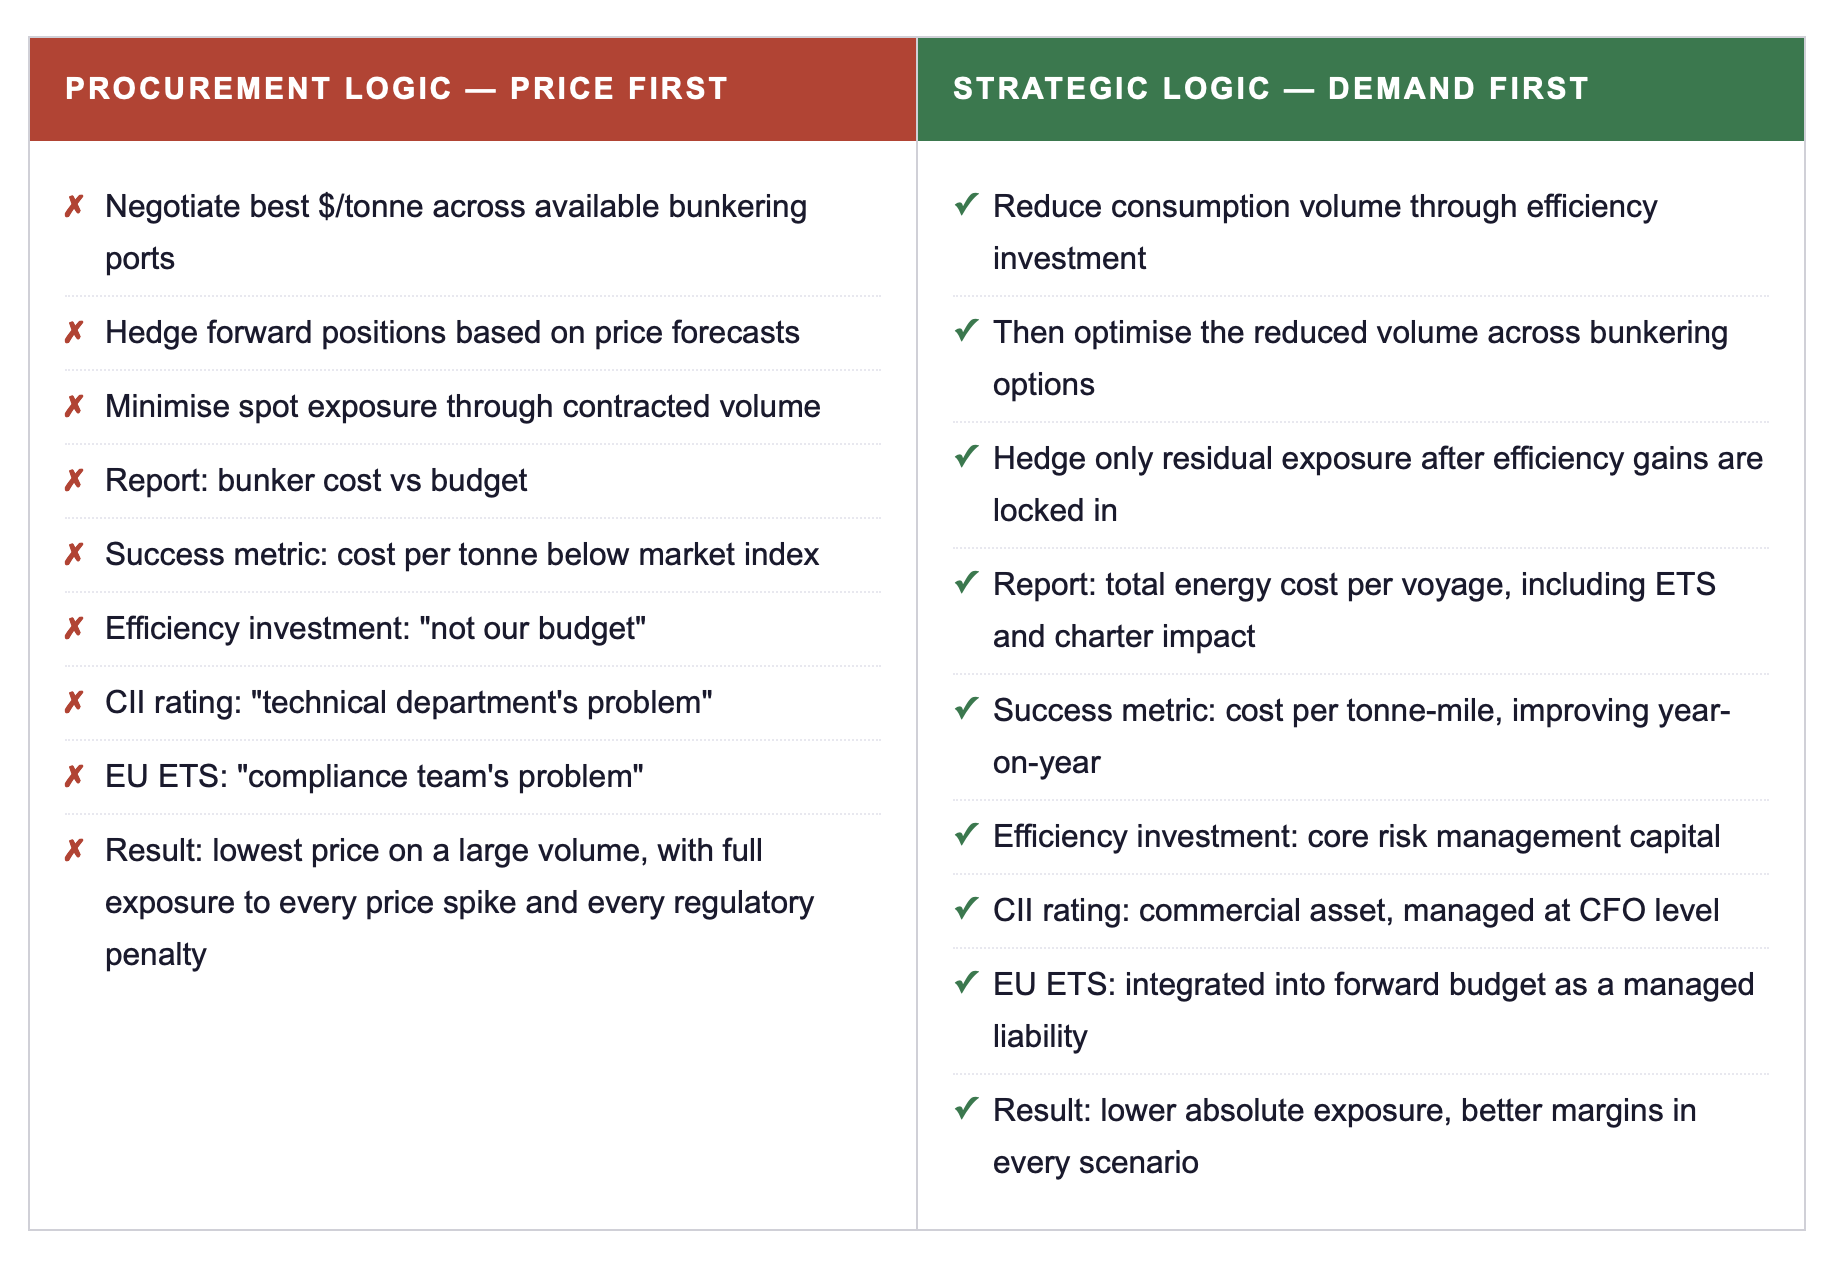
BCG (2025) confirms that shipping companies following the demand-first sequence, those that have invested in measurable efficiency improvements before optimising procurement, consistently achieve lower total energy cost per voyage than peers with superior procurement programmes but higher consumption volumes. The finding holds across freight rate cycles, bunker price scenarios, and vessel class categories. It is not market-timing. It is structural sequence.
The mechanism is straightforward. A vessel consuming 18,700 MT/year (after a 15% efficiency improvement from 22,000 MT) has structurally lower exposure to every price movement, every EU ETS liability increase, and every charter market shift than a vessel consuming 22,000 MT, regardless of the price that procurement negotiated for each tonne. The base of the exposure has been reduced. Procurement optimises what remains. Strategic energy management creates the conditions under which procurement can operate most effectively, by shrinking the target.
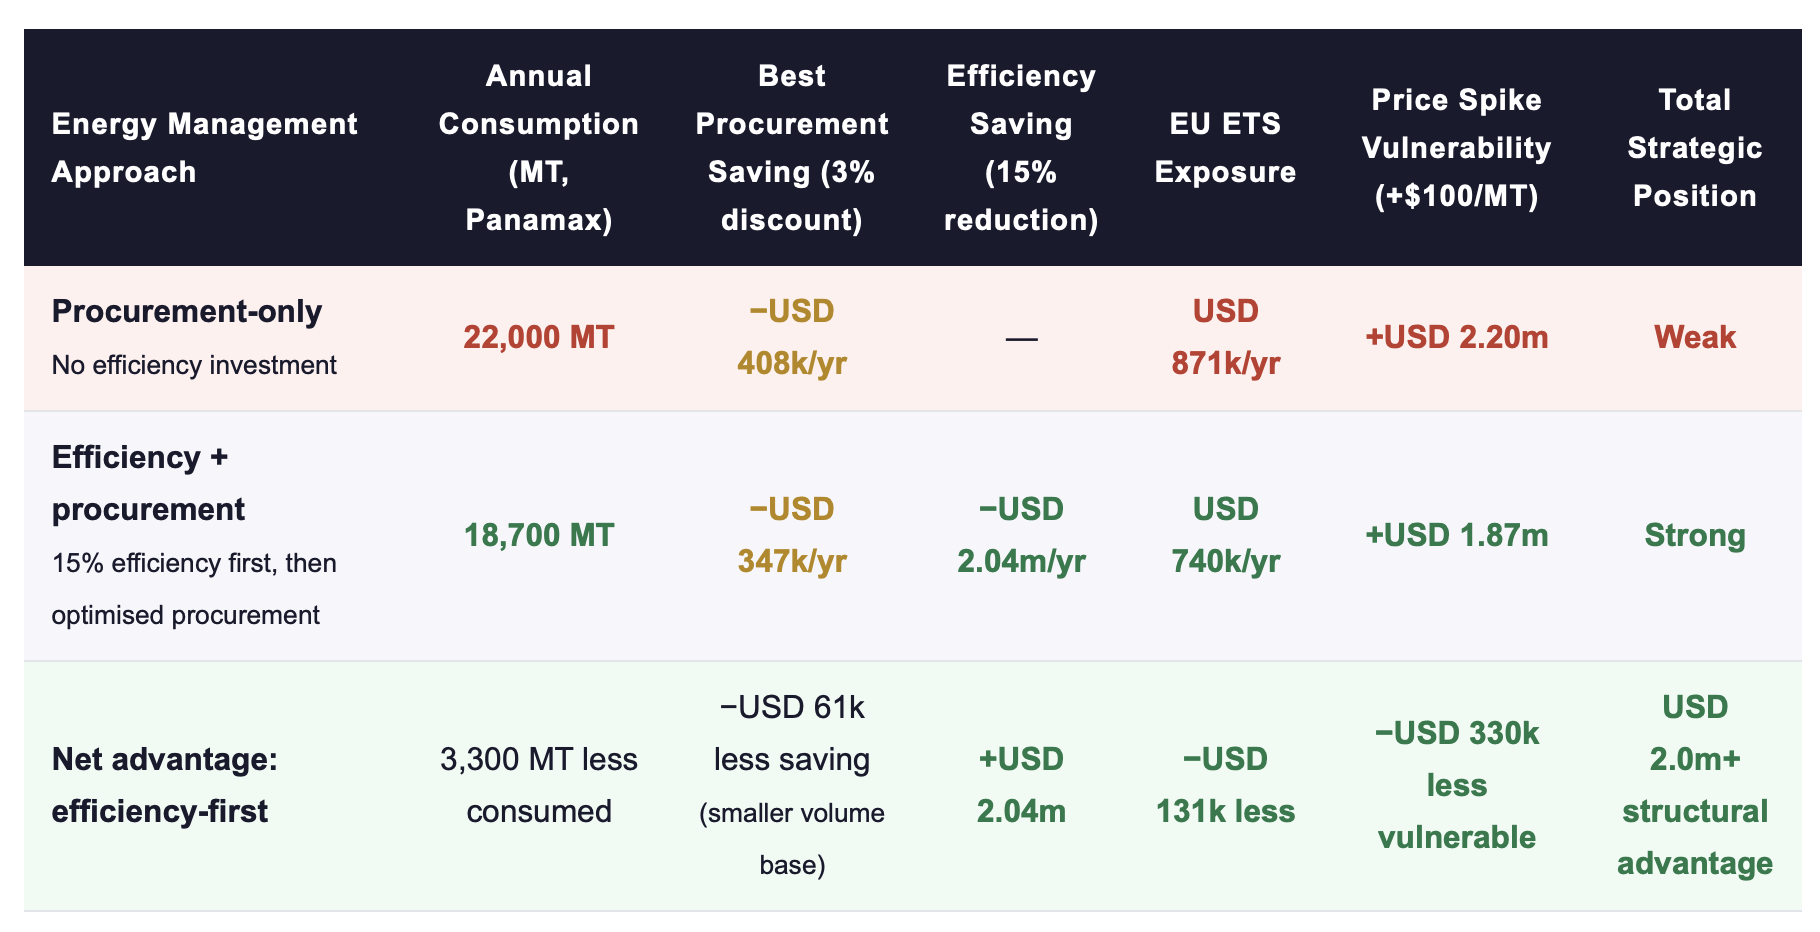
Panamax 65,000 DWT, VLSFO $620/MT, 280 operating days. EU ETS at €50/tonne CO₂, 50% phase-in, 3.206 tCO₂/tonne VLSFO. Price spike: +$100/MT applied to full annual consumption. Sources: ABS, 2025; PwC, 2026; own modelling.
The table makes one point impossible to miss: when the efficiency-first approach reduces the consumption base from 22,000 MT to 18,700 MT, it costs the procurement team USD 61,000 in foregone volume discount, because they are buying less fuel. That cost is not a loss. It is the accounting consequence of saving USD 2.04 million in fuel spend. The procurement view records it as a lost saving. The strategic view records it as the intended outcome.
👉 Key Insight: The most effective procurement team in shipping operates on the smallest possible consumption base. Efficiency investment does not compete with procurement, it creates the conditions under which procurement works best. The sequence must be: reduce first, then optimise. Operators who invert this sequence, optimise first, then consider reduction, are permanently managing a larger exposure than necessary.
4. Procurement vs Strategy: The Governance Gap
The Lloyd's List Shipping Podcast episode "Decarbonisation is a significant factor in commercial decision-making" (April 2026, Sean Riley, Veson Nautical) identifies the governance gap precisely: energy decisions that belong at the commercial and financial strategy level are being made, or deferred, at the procurement level. The consequence is not just sub-optimal fuel buying. It is a systematic failure to connect energy performance to EBITDA, charter strategy, and financing structure.
The governance gap manifests in four specific disconnects that characterise procurement-led energy management:
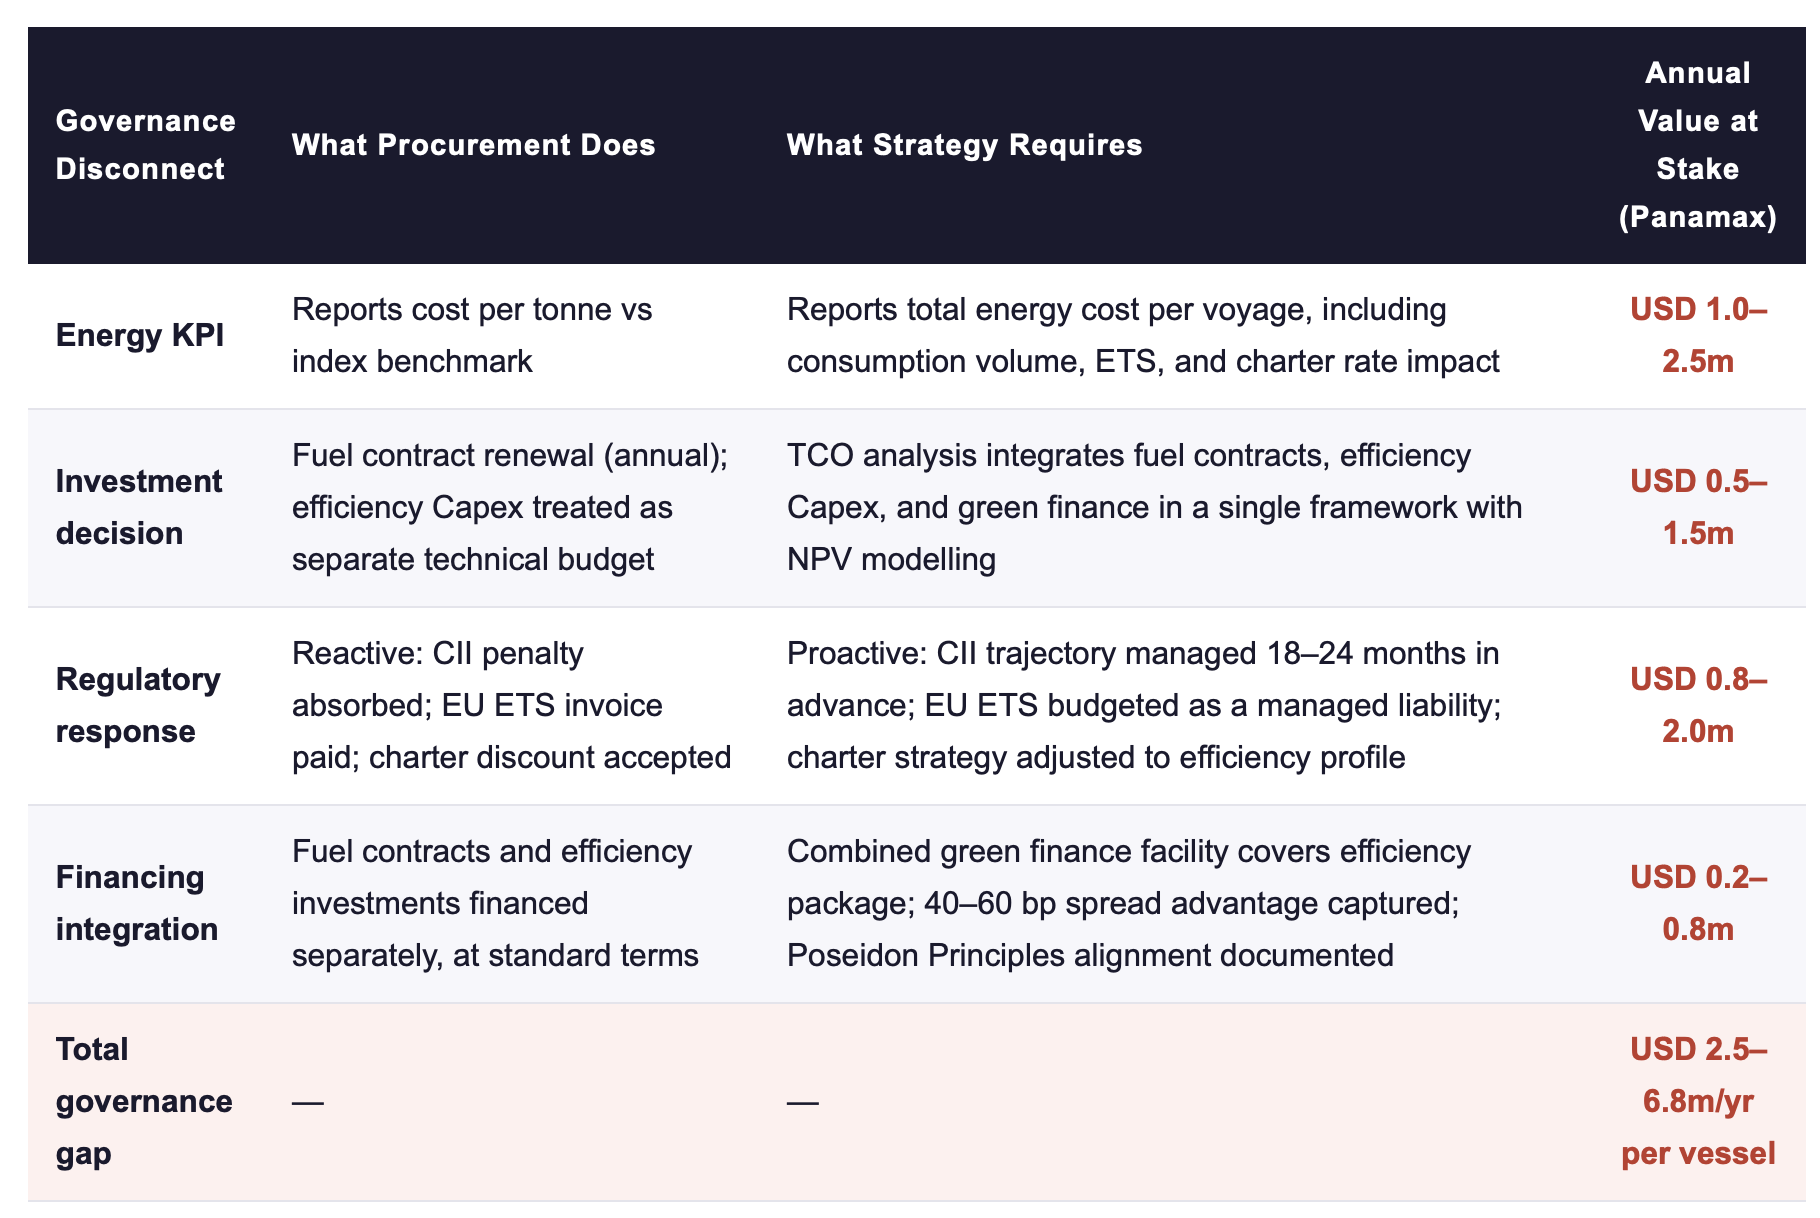
Value at stake estimates for Panamax 65,000 DWT, VLSFO $620/MT, $13m TCE revenue. Sources: BCG, 2025; PwC, 2026; Global Maritime Forum, 2026; own modelling.
👉 Key Insight: The governance gap,the total value destroyed by managing energy at the procurement level rather than the strategic level, is USD 2.5–6.8 million per vessel per year for a mid-size Panamax operator. For a fleet of ten vessels, that is USD 25–68 million in annual value destruction. It is not a policy disagreement. It is a measurable, quantifiable management failure.
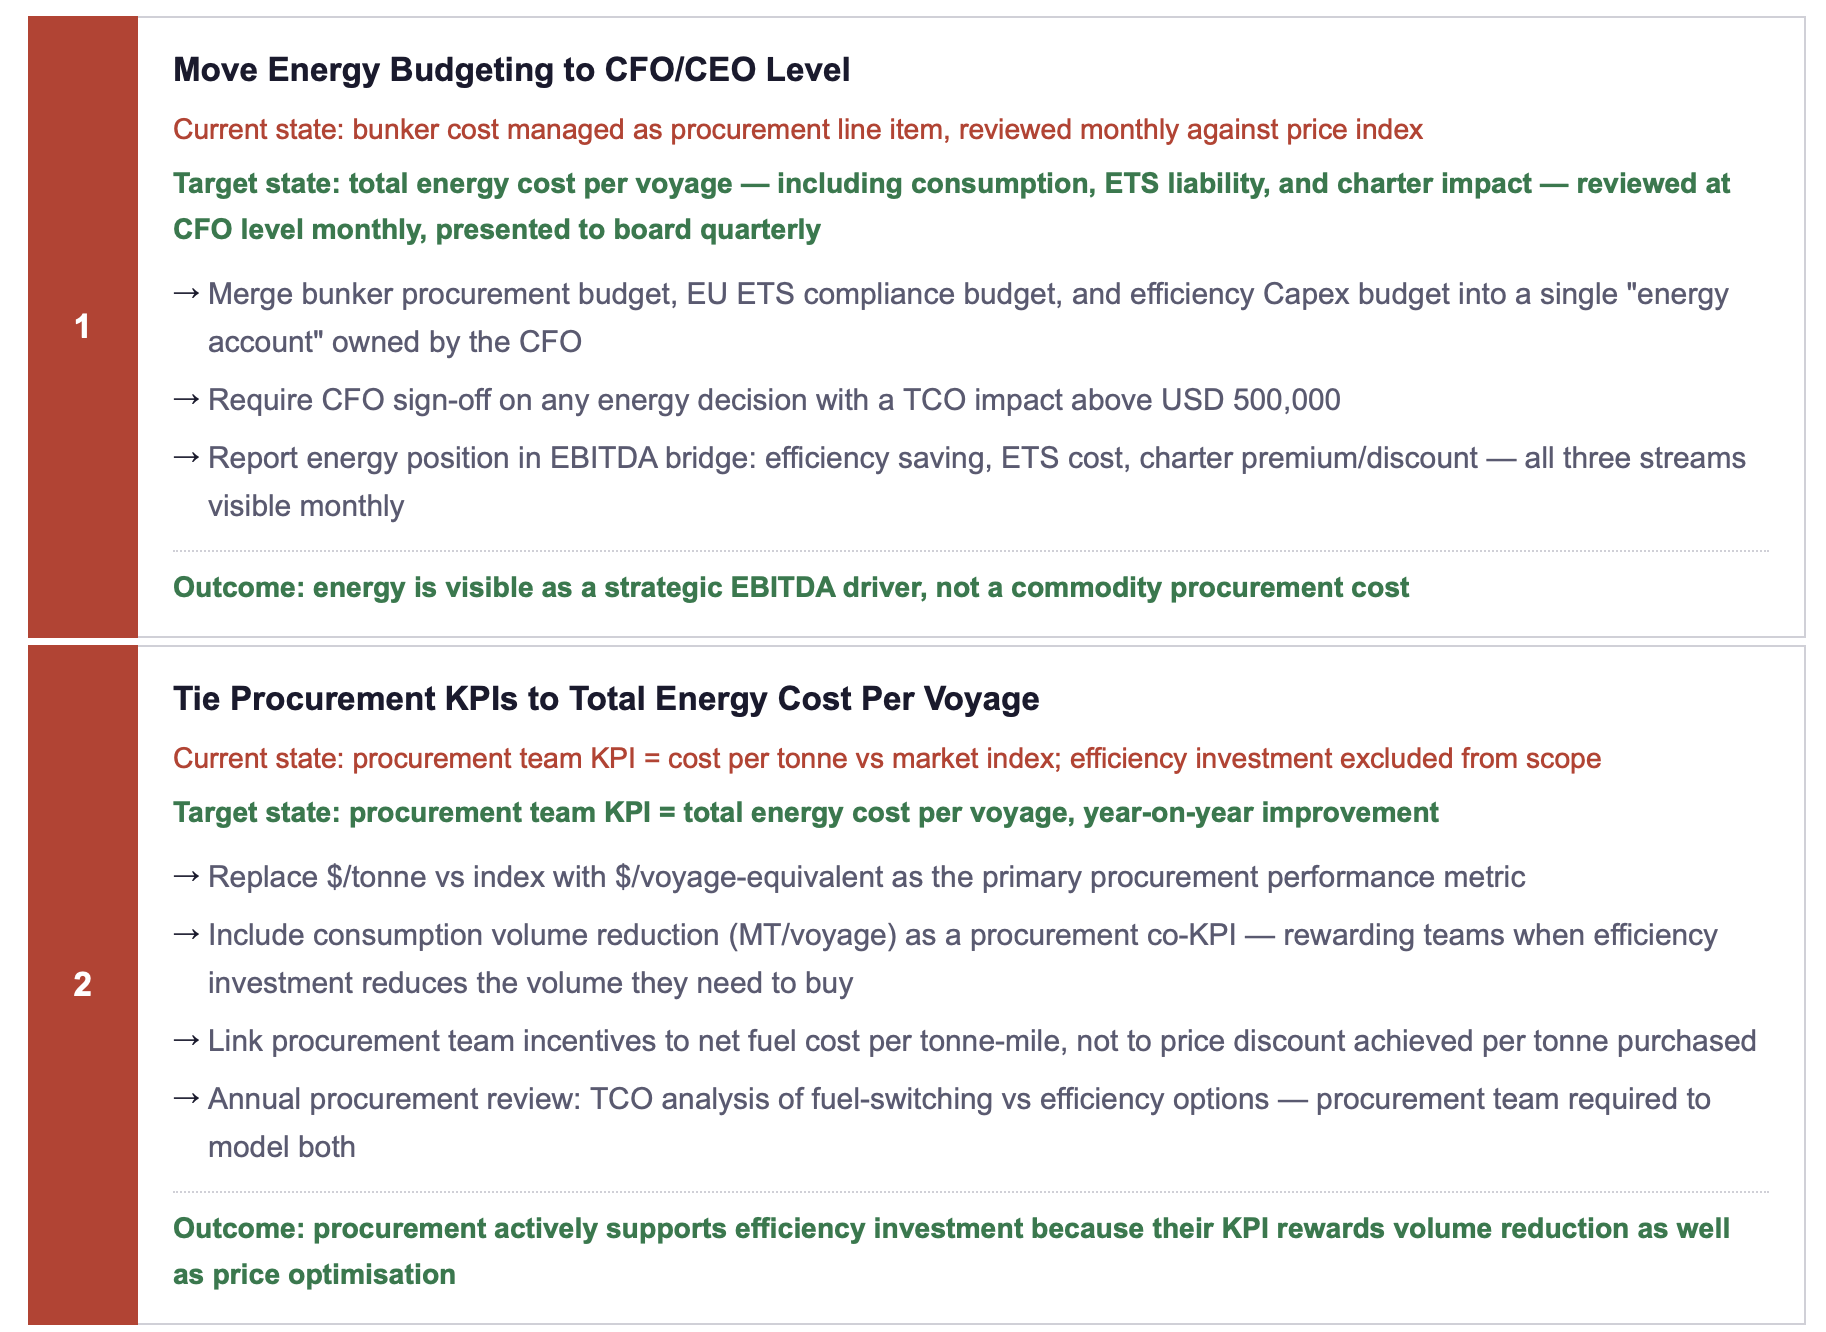
5. The Transformation Roadmap: From Procurement to Strategy
The transition from procurement-led to strategy-led energy management does not require a new department, new technology, or new personnel. It requires four structural changes in how decisions are made, who makes them, and what metric they are made against.
ACTION RECOMMENDATIONS
IMMEDIATE MEASURES (0–90 DAYS)
Calculate the governance gap for your fleet: what is the total energy cost per voyage (fuel + ETS + charter impact) for your top five vessels, and how does this compare to what your procurement team reports as "bunker cost"?
Present the procurement vs strategy comparison (Fig. 1 format) to the CFO: USD 408k procurement saving vs USD 2.04m efficiency saving on the same Panamax. This is the conversation that reframes the governance structure.
Review the current procurement team KPI framework: if it includes $/tonne vs index but excludes total energy cost per voyage and consumption volume trend, the structural misalignment is confirmed, and addressable immediately.
Identify one vessel currently under drydock planning where the procurement team's fuel contract renewal is the dominant investment conversation, and require a parallel efficiency TCO analysis before the drydock specification is finalised.
STRATEGIC COMMITMENTS (6–24 MONTHS)
Consolidate energy budgeting under the CFO: merge bunker procurement, EU ETS compliance, and efficiency Capex into a single energy account with unified reporting to board level.
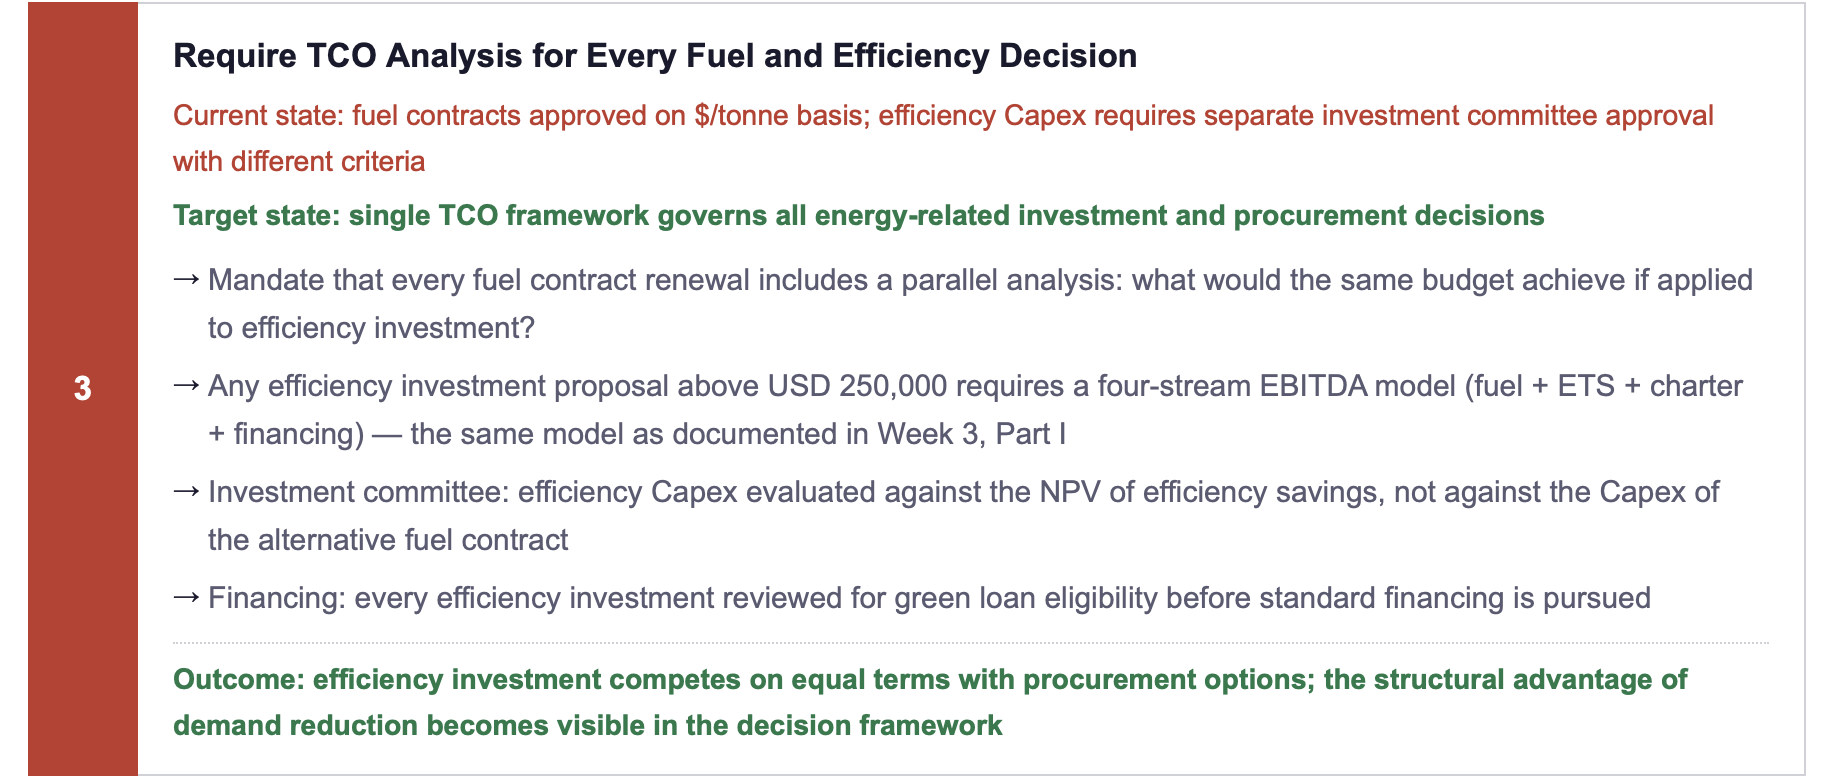
Redesign procurement team KPIs: replace $/tonne vs index with $/voyage total energy cost as the primary metric; add MT/voyage improvement as a co-KPI that rewards consumption volume reduction.
Mandate TCO analysis for every energy decision above USD 250,000, fuel contracts and efficiency investments evaluated on the same framework, with the same four-stream EBITDA model.
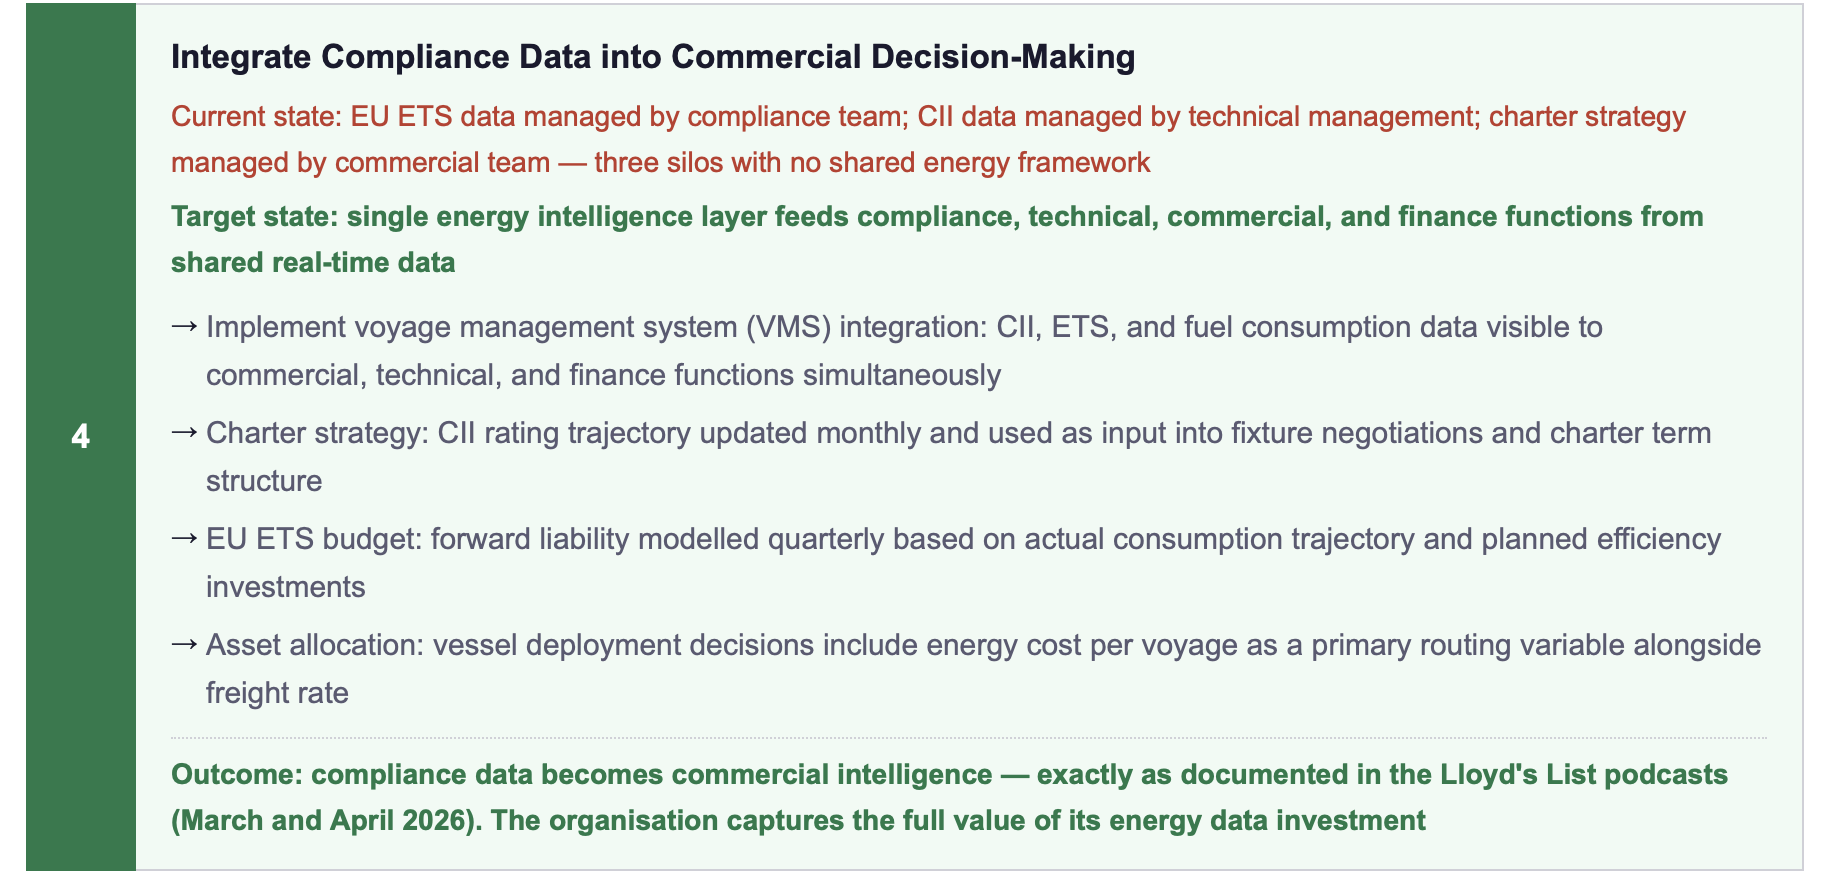
Implement a shared energy data layer: CII, ETS, and fuel consumption data accessible to commercial, technical, finance, and compliance functions from a single source, the foundation for the compliance-to-commercial-intelligence shift documented in the Lloyd's List Podcast (March 2026).
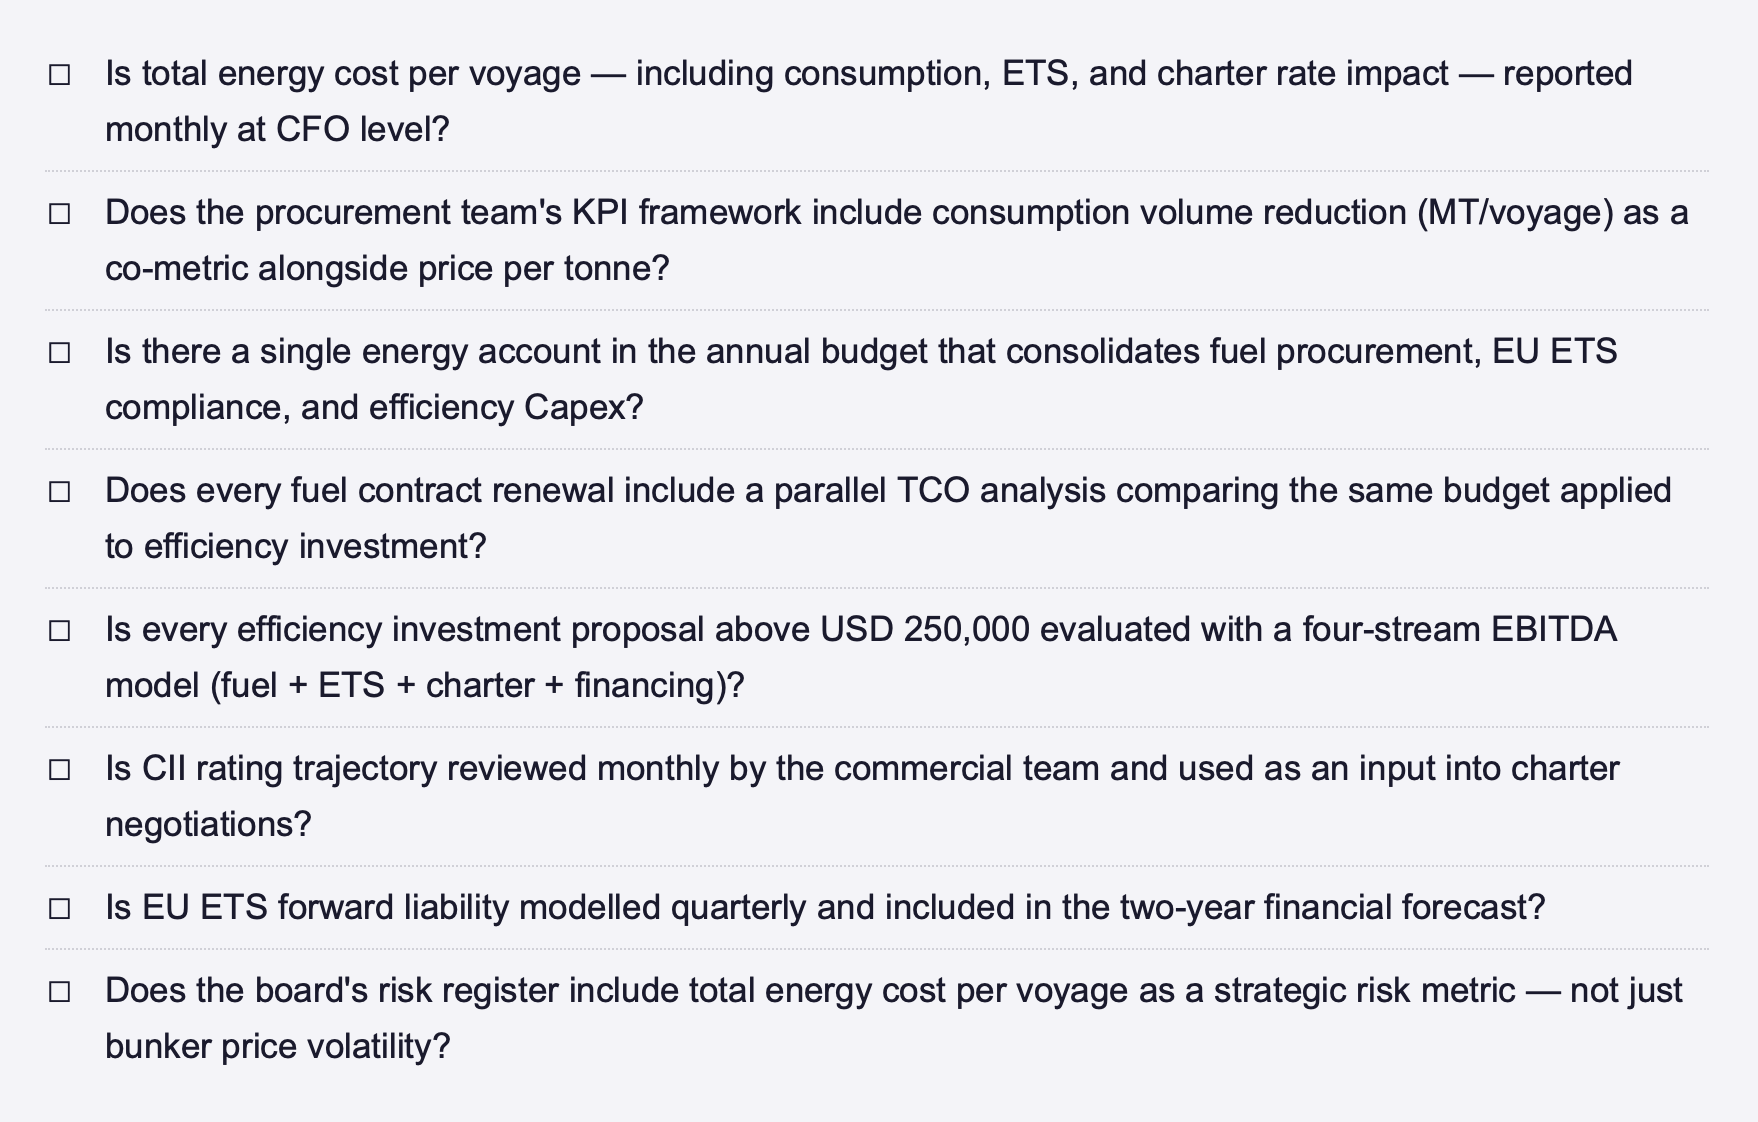
ENERGY STRATEGY GOVERNANCE CHECKLIST, IS ENERGY MANAGED AT THE RIGHT LEVEL?
FINAL THOUGHT
Procurement is not the problem. Procurement thinking applied to a strategic question is the problem. The distinction matters because it determines the solution. Replacing the procurement team solves nothing. Replacing the metric, from price per tonne to total energy cost per voyage, changes everything downstream: which investments get approved, which KPIs drive team behaviour, which data gets integrated into commercial decisions, and which governance structure owns the outcome. The shipping companies documented in BCG (2025) as top-quartile performers on both energy and financial metrics did not get there by negotiating better fuel contracts. They got there by treating energy as an operational asset requiring strategic management, by investing in demand reduction before optimising supply, and by connecting their efficiency performance to every commercial, financial, and regulatory decision the business makes. That is not procurement. That is energy strategy, and the gap between the two is precisely USD 2.5–6.8 million per vessel per year.
How is energy currently governed in your organisation, at the procurement level, the technical management level, or the CFO/CEO level? And what would need to change for the shift to demand-side energy management to become a board-level commitment? Connect for a direct exchange or share your governance model. | This post is Part II of Week 3. See Part I (From Efficiency to Profitability) for the EBITDA framework that procurement thinking consistently fails to capture.
Note: This article reflects my personal views based on industry experience and publicly available information. It does not constitute professional, legal, or investment advice and does not represent the views of my employer.
REFERENCES
BCG (Boston Consulting Group) (2025) The Energy-Efficient Route to Maritime Decarbonization: Fleet Performance, Financial Outperformance, and ROCE Differentials. Boston: BCG.
Global Maritime Forum (2026) Operational Efficiency Report: Demand-Side Energy Management and Fleet Decarbonisation Pathways.Copenhagen: Global Maritime Forum. January 2026.
Lloyd's List Intelligence (2026a) Shipping Intelligence Podcast: "Decarbonisation is a significant factor in commercial decision-making."Speaker: Sean Riley, Veson Nautical. April 2026. London: Lloyd's List.
Lloyd's List Intelligence (2026b) Shipping Intelligence Podcast: "What to look out for in decarbonisation in 2026." January 2026. London: Lloyd's List.
PwC (2026) Sustainable Shipping Economics: Green Finance Eligibility, EBITDA Impact Modelling, and Asset Valuation Effects of CII Rating. London: PricewaterhouseCoopers.
ABS (American Bureau of Shipping) (2025) Retrofits for Energy and Emissions Improvement. Houston: ABS.
© René Grywnow, DBA · Strategic Intelligence Brief · April 2026Efficiency Before Fuel Series · Week 17, Part II
Note: This article reflects my personal views based on industry experience and publicly available information. It does not constitute professional, legal, or investment advice and does not represent the views of my employer.